
Mayo Report for 2021-07
|
|
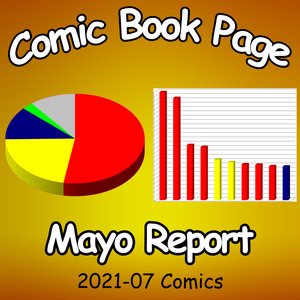
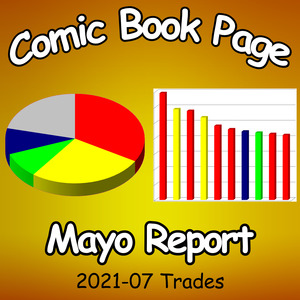
Top Comics List Top Comics Breakdown Top Trades List Top Trades Breakdown
July 2021 had 6,040,611 units in the top 300 comics list, a decrease of 162,482 units from last month. That is over half a million units below the average of the total units top 300 comics from February 2003 to March 2020. Of course, that period of time included DC while this month and last month do not. More on that later in the article.

The premiere publishers accounted for 91.65% of the total units for the top 300 comics this month while all of the other publishers with items in the top 300 accounted for 8.35% of the total units for the top 300 comics.
Marvel Comics placed 3,191,396 units in the top 300 comics, a decrease of 287,679 units and accounted for 52.83% of the total units. Marvel averaged 3,003,811 units in the top 300 from February 2003 to March 2020 and averaged 3,335,236 units this month and last. August and September will provide two more data points for how Marvel is currently doing before distribution shifts from Diamond to Penguin Random House. The October data will should what impact that shift has on Diamond and, by extension, what impact it might have on the rest of the industry.
Image Comics placed 1,340,345 units in the top 300 comics, an increase of 229,215 units and accounted for 22.19% of the total units.

The up-swing of 2,802,771 units from new and increased sales was not enough to compensate for the down-swing of 2,965,253 units from lost sales for the net decrease of 162,482 units.
Since it has been well over a year since we've had two consecutive months of sales data, I will give a quick description of each title status as we look at each one. There are many different ways to look at the monthly sales data. This title status framework provides a way to group the titles by how they impact the month-to-month total of the top 300 comics.

Continuing Titles (Gained Sales) are titles which were published in the previous and current months with the same number of issues released in both months for each title and which sold more units in the current month than in the previous month. This category can only represent an increase in sales.
The 25 titles across the 9 publishers in the continuing titles which gained sales category accounted for 651,596 units in the top 300 comics with an upswing of 60,333 units.
Walking Dead Deluxe had two issues released in July, the second of which reprinted the debut of Michonne. That issue sold 55,912 units and came in at rank 20. While sales of the Walking Dead trades into stores have cooled off, the sales on this reprint series seem strong. Unfortunately because of the lengthy data gap, only the initial month sales for four of the nineteen issues are available.

Continuing Titles (More Issues) are titles which were published in the previous and current months with more issues released in the current month than the previous month. This category usually represents an increase in sales but can contain titles which dropped in sales from month-to-month depending on the sales of the various issues. For example, a high selling first issue in the previous month followed by a sharp second issue drop and a third issue drop in the current month could result in a loss in sales despite more issues released. The number of new comic book days per month can influence how many issues are released in the two months. In this case, there were five shipping weeks in June and four in July.
The 4 titles across the 2 publishers in the continuing titles which shipped more issues category accounted for 78,628 units in the top 300 comics with an upswing of 34,444 units, a downswing of 8,761 units for a net an increase of 25,683 units.

Continuing Titles (Stable Sales) are titles which were published in the previous and current months with the same number of issues released each in both months with a drop of no more than 250 units for the title between the current month sales and the previous month sales. The 250 units is admittedly an arbitrary number. With around 2,000 or 3,000 comic book stores, a change of 250 units represent a minority of stores adjusting their order on average by a single unit. Despite the name, this category can only represent a drop in sales.
The 18 titles across the 10 publishers in the continuing titles with reasonably stable sales category accounted for 145,081 units in the top 300 comics with a downswing of 2,469 units. Firefly: Brand New Verse lost only 5 units while Usagi Yojimbo lost 241 units.

Continuing Titles (Fewer Issues) are titles which were published in the previous and current months with fewer issues released in the current month than the previous month. This category usually represents a drop in sales but can contain titles which increased in sales from month-to-month. For example, two low selling issues in the previous month followed by a huge spike in sales on a single issue released in the current month could result in an increase in sales for a title even with fewer issues released.
The 4 titles across the 2 publishers in the continuing titles which shipped fewer issues category accounted for 191,991 units in the top 300 comics with a downswing of 75,957 units.

Continuing Titles (Lost Sales) are titles which were published in the previous and current months with the same number of issues released each in both months which sold fewer units in the current month than in the previous month. This category can only represent a drop in sales. Even an significant drop in sales does not mean the title is selling poorly. It all depends how the titles sold in the prior month.
The 104 titles across the 15 publishers in the continuing titles which lost sales category accounted for 1,981,486 units in the top 300 comics with a downswing of 735,832 units.
Star Wars: War of the Bounty Hunters dropped 96,655 units from last month and accounts for 13.14% of this category. The first issue sold 179,115 units last month with another 10,508 units of reorder activity the month. The second issue sold 82,460 units this month in rank 7. This is an example of a title which dropped significantly but it still selling very well.
Basilisk, on the other hand, dropped 27,994 units but that represents a loss of 51.43% from the first issue which sold 54,432 units last month to second issue which sold 26,438 units this month. An more extreme example this month is Good Luck which lost 18,416 units which represents a second issue drop of 70.91%.
The point of these title status categories is to show how the total units for the top 300 comics changes from month to month, not to focus on the percentage change for each individual title. While a drop of over 70% is very significant for a title, the drop of 18,416 units is only 0.3% of the 6,040,611 units for July 2021 while the drop on Star Wars: War of the Bounty Hunters, on the other hand, equates to 1.6% of that total.

New Titles are new titles or new volumes of existing titles. In many cases, these are simply replacing a recently concluded title and aren't as new as the category name might seem to imply. Since there are not previous sales to compare against, New Titles represent an increase in sales each month. Since this category can only represent an increase in sales.
The 73 titles across the 25 publishers in the new titles category accounted for 2,148,065 units in the top 300 comics with an upswing of 2,148,065 units.
The launch of the latest X-Men volume with 248,800 units this month accounted for 11.58% of this category. The launch of the latest Moon Knight volume with 235,247 units accounted for another 10.95% of this category. The Skybound X miniseries totaled to 222,108 units from the first four issues of the miniseries. That miniseries accounted for 10.34% of the total for this category and concludes with the final fifth issue next month. Those three titles combined accounted for nearly a third of this category. Those 706,155 units accounted for 11.6% of the top 300 comics total for the month which shows how just a few titles can have a noticeable impact on the total sales for the month.

Returning Titles are titles which were not published last month and were in either the Suspended Titles or Defunct Titles categories and shipped in the current month. Returning Titles represent an increase in month to month sales and therefore has the same number of units on both the units and delta charts.
The 13 titles across the 4 publishers in the returning titles category accounted for 224,394 units in the top 300 comics with an upswing of 224,394 units. Marvel accounted for 71.99% of this category.

Suspended Titles are the titles which didn't ship this month but are expected to ship in the future because there are issues which have been solicited but not shipped or canceled. Sometimes the title is not expected to ship in the month while other times an issue is delayed and the titles ends up with no issues released in the month. Suspended Titles represent a decrease in sales from month to month but are not sales drops for the titles since sales can't be considered lost until the next issue ships with lower sales. Regardless, retailers can't sell comics which haven't shipped. Titles can drop below the radar of the top 300 comics list and the sales are considered suspended when that happens.
The 31 titles across the 13 publishers in the suspended titles category accounted for a drop of 454,062 units from last month. Marvel accounted for 57.4% of this category.

Defunct Titles are title believed to have ended with the previously shipped issue because there are non known future issues solicited. Defunct Titles represent a presumably permanent decrease in month to month sales with the caveat that these titles might get continued as some point in the future. There have been numerous cases in which titles have continued years later or reverted to a previous numbering sequence, acting as continuations of titles previously considered defunct. Any title with no future issues solicited is considered to be Defunct and as a result, while most of these titles have ended, some might be quarterly or just have a lengthy gap in the release schedule. All too often, title in this category one month show up in the New Titles category in the following month with a new volume.
The 55 titles across the 16 publishers in the defunct titles category accounted for a drop of 1,682,412 units from last month. Marvel accounted for 66.02% of this category with a loss of 1,110,742 units from last month.

Annuals/Specials are the annuals and specials which are part of a title but aren't a regular issue of the series. This category can increase or decrease the total units for the top 300 comics list depending on the number of annuals and specials that shipped in the current and previous month.
The 7 titles across the 3 publishers in the annuals/specials category accounted for 96,457 units in the top 300 comics with an upswing of 96,457 units, a downswing of 110,978 units for a net a decrease of 14,521 units. Marvel accounted for all of the units this month but only a third of the delta in this category.

Reorders are items which have placed on the list in a past month and have managed to get enough additional sales for an issue to get onto the top 300 comics again. Reorders can increase or decrease the total units for the top 300 comics list depending on the number reorders in the current and previous month.
The 45 titles across the 10 publishers in the reorders category accounted for 522,913 units in the top 300 comics with an upswing of 476,770 units, a downswing of 132,474 units for a net an increase of 344,296 units.
Stray Dogs is the clear winner in this category with an increase of 168,250 units over the sales of last month for a total of 183,102 units spread across the five issues of the miniseries. The first issue did 52,931 units of reorders this month on top of 9,577 units of reorders last month. The second issue did 29,855 units of reorders this month on top of unknown initial sales and any other possible reorders. The third issues did 28,066 units of reorders this month on top of unknown initial sales and potential prior reorders. The fourth issue did 27,404 units of reorders this month and 5,275 units of reorders lat month on top of unknown initial sales and potential prior reorders. The fifth issue did 44,846 units of reorders this month on top of the 24,816 units it did in June when it was released. If all of those sales happened last month then the fifth issue would have been in rank 11 last month instead of rank 80. Even if the reported sales are the only sales for it this is a successful series. Given the data gap from May 2020 to May 2021 we know the initial sales and reorders prior to June 2021 all went unreported by Diamond.
Walking Dead Deluxe has no reorder activity this month and had half a dozen issues last month with average reorders around 5,600 units. The color reprint series seems to be selling stronger than the series original did for those issues. This is another case in which the data gap prevents us from knowing the full picture on the sales history of the current titles.
Comparing the current total of the top 300 comics with DC to the total without DC to the historical top 300 with DC isn't entirely a fair comparison. We need something which measures the same thing before and after the lengthy data gap to see how the current sales compare to the sales history. To do that, we need to take DC out of the equation.

The top black dashed line is the total for the top 300 comics using the "old method" of including DC and is included for reference. The solid black line is the total for the top 150 comics using the "old method" of including DC. The red line is the top 150 comics calculated ignoring the items from DC. I'm treating April 2020 as a zero sales point since the industry effectively shut down for that month. Obviously the peaks and valley in sales without DC don't exactly match the ones with DC factored in. The launch of the New 52 in August of 2011 is an extreme example of how the sales of DC can shift the overall sales trend.
The sales of the top 150 items not including DC items (the red line) is noticeably higher to the right of the extended period of no sales data than it was before the data gap. The sales of the top 150 comics without in June and July 2021 are also on par with the average sales of the top 150 including DC for the the period of February 2003 to March 2020. This indicates stores might be able to do perfectly fine without DC. That having been said, obviously the sales of DC items only serve to increase the total sales. We may never know how large or small the impact those DC sales are each month since those sales haven't been reported since DC left Diamond in April 2020.
The choice of 150 items was based on there always being at least 150 items not from DC within the top 300 every month from February 2003 to March 2020. Once Marvel shifts from distributing through Diamond to Penguin Random House in October, another sort of adjusted sales total might be needed and will probably have to be limited to the top 50 or 75 items in order to have a consistent number of items each month over time. The limiting factor here is Diamond only released the top 300 comics for much of the period from February 2003 to March 2020. As the number of items drops, so does how closely it resembles the historical trends of the total units for the top 300 comics including DC and Marvel. Obviously, since Marvel and DC are the largest two publishers and typically have the majority of the strongest items the trends shift a bit when either or both of those publishers are excluded.
Overall, comic book sales for July seems good even if they are down a little from last month. Unfortunately, two data points defines a line, not a trend. Given the lengthy data gap from May 2020 to May 2021, it is going to be a while before there is enough data to generate meaningful charts of specific titles. For some ongoing titles, and for comparisons across various titles for a given property, this data gap will be a hindrance for that sort of analysis moving forward.
Once again, I'd like to encourage Diamond to retroactively release the sales data for May 20202 to May 2021 and to encourage Lunar and UCS to release sales for what they have distributed. The potential insights from the sales data during the pandemic could deepen our insights into the sales trends and the factors that influence them. That deeper understanding can only serve to help the industry.
For a more in-depth discussion of the sales data, check out the Mayo Report episodes of the Comic Book Page podcast at www.ComicBookPage.com. The episode archived cover the past decade of comic book sales on a monthly basis with yearly recap episodes. In addition to those episodes on the sales data, every Monday is either a Back Issue Spotlight focusing or the Monthly Comics Spotlight episode covering various items by DC, Marvel and the other publisher from the past month. I used to read around 200 new comics a month but my reading habits changed during the pandemic. If you are looking for more or different comics to read, check out the latest Previews Spotlight episode featuring clips from various comic book fans talking about the comics they love. With thousands of comics in Previews every month, Previews Spotlight episodes are a great way to find out about new comic book titles that may have flown under your comic book radar.
![]()
![]()